ISTA 352 - Images:
Past, Present, and Future - Fall 2012
Assignment
Three (A)
Note
change of format---this assignments has been broken into two smaller units
Due: Late (*) Tuesday, October 09.
(*) "Late" means that the instructor
might start grading by 8AM Wednesday. Once the instructor starts grading, no
more assignments will be accepted.
5 points
This assignment should be done individually
You can do the programming parts of this assignment in any language you like,
although if your results are anomalous, and the grader does not speak the language
you use, they may be less able to quickly figure out what the problem is and
give you reasonable part marks.
Regardless of what language you use, please follow the instructions linked here carefully.
Deliverables
Deliverables
within questions are flagged with ($).
This
assignment has 2 regular questions, and one (not that hard) challenge problem. The
first regular problem is worth 2 points, and the second one is worth 3, for a
total of 5.
:
- (+) (This continues the example in class). Suppose a camera (center of projection) is located in
at (1, 2, 3)T in world coordinates. Further, suppose that its axes
are parallel to the directions from the origin to the vectors (3, 4, 0)T and (-4, 3, 0)T and (0, 0 5)T. Finally, assume that this is the standard canonical
camera with unit focal length (f=1). Derive a single matrix that can be
used to map homogenous world coordinates into homogeneous image
coordinates on this camera’s image plane. There is no need to further map
the coordinates into a real image plane (we are ignoring the intrinsic
parameters). Provide your matrix (you can use Matlab to do the arithmetic,
but be sure to show your work) ($).
Use
the matrix you found to compute where the following 3D
world points end up on the image plane ($).
i)
(0, 0, 0) ($)
ii)
(2, 2, 2) ($)
iii)
(1, 2, -2) ($)
Repeat the above where the focal length
is 2 to provide a second matrix, and apply it to compute where the points end
up with the new focal length ($).
- (++) The image
sets
stereo-pair-1.tiff left-1.tiff right-1.tiff
and
stereo-pair-2.tiff left-2.tiff right-2.tiff
are sets of left and right views of a
random dot stereogram. One image shows the pair together, and if you look at it
in the right way, you should be able to see the 3D effect. (Try focusing
between beyond the images (and relax). Some people suggest that you are looking
at them almost cross-eyed. You may need to vary the distance to the screen to
get things to pop into place). Getting the 3D effect is not that easy to do the
first time, and this assignment does not require that you succeed. But it is
worth trying to make it work, as it will help you understand what is going on,
as well as provide you with some sense of the correct answer.
Your first task is to write a program
that computes the disparity between the image locations. You can assume the
simple stereo setup that we worked with in class. In particular, the match for
a point (x,y) is (x’, y). In other words, to find a match for a point in the
one image, you search along the corresponding row in the second image. To find
a match, proceed as follows. Consider a maximum disparity of 12 (either to the left or the right). We want
to step through the 25 possible shifts and test each one for a best match. In
Matlab notation this is -12:12. For each test shift, we want to ask how well
the neighborhood of our point matches the neighborhood of the corresponding one
under consideration. We can do this by taking the dot product of two vectors
centered on each that are long enough to capture the similarity, but not so
long that they are no longer local. Try 21 to start (you might find it easier
to think of “21” as -10:10 in Matlab). Have a look at the figure before reading
on.
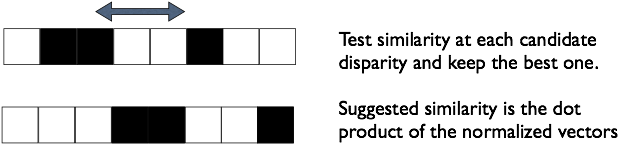
As suggested in the figure we can measure
similarity by taking the dot product of the vectors of length 21 centered on
the test alignment. You may find that normalizing the vectors first (to unit
length) works better, but for this you need to test that the vector is not zero
first, and skip normalization if it is, least you divide by zero.
Your program should record the absolute
value (to make things a bit easier) of the best shift for each point. Your
program should display your disparity map as an image, appropriately scaled.
You will notice that you cannot do much
at image edges, and if you were to try to do so, you will be spending a lot of
time debugging out-of-bounds indexing. So you can assume that the disparity on
the left and right margins is zero. Restrict your left-right search as
appropriate. (Specifically, if the disparity is in –D:D and the matching vector
indexes –C:C, then I think restricting your horizontal index from 1+margin to
n-margin, where margin=D+C should work (in Matlab)).
You should hard code the image file names so that if the TA were to run your program, they would see disparity maps for both data sets. In addition, you should put the depth map images into your PDF with some description about what you did and what you found ($).
Your program should also output the average of the top 10% absolute value disparities. (We are assuming that there is only one interesting distance other than that background). Report this disparity ($). Finally, supposing that pixels are 0.025cm, and that the focal length is 2cm, what distance would be associated with the surface using the formula developed in class? (You can assume that in the distance equation developed in class that d-D is approximately d, and that the distance between human pupils is 60mm). ($).
(*) If you want to extend this in some way, please do so, and explain in your writeup what you did. You could consider what the trade-offs are between longer and shorter correlation windows, run some experiments and explain the results. You could create more complex scenes and run your program on them. You could think more rigorously about what, if anything, the distance you just computed means.
Challenge problems
Challenge problems are not required, but can be exchanged for non-challenge problems, or done for modest extra credit. They provide flexibility for students who are especially interested in the subject, and who are comfortable with their understanding of the basics. They can be difficult and often require some math skills that are not pre-requisite for this course. I recommend being careful about spending too much time on them.
- (*) Show algebraically that with the basic stereo setup (horizontally aligned, parallel view directions), the point corresponding to (x,y) is (x’,y’) where y’=y. IE, the height of the corresponding point is the same which justifies working row by row in the previous question. Can you phrase what you just showed in terms of epipolar lines? (The ray describing the possible locations of a point in this setup is k(x,y,f)).
What
to Hand In
Consult
the instructions linked here for conventions for preparing and handing
in assignments. In 2012, hand in assignments via email to Kyle Simek
(ksimek@email.arizona.edu).